
With excitement I opened my last edition of the Journal of Revenue and Pricing Management, immediately I turned to the opening editorial to face this.
A blank sheet of paper! So, here we stand staring at Revenue Management and Analytical Pricing being just a blank sheet of paper.
Granted the situation is dire because we are facing a world in which TODAY and TOMORROW certainly do not look like YESTERDAY. For a pricing and revenue management systems, this is looking at the End of History! All historical data is irrelevant, and with that all time series forecasters, regression models and statistical methods are rendered irrelevant.
Well, friends it is time to stop being terrified of a blank sheet of paper!
See instead a tabula rasa; a blank slate inviting us to re-examine how we architect pricing / revenue management systems. COVID-19 offers us a gift, not a curse. This is a time to address the inadequacies of our revenue management or dynamic pricing systems that we have accepted as a given for more than a decade.
When we are handed a blank slate, open your mind and look for alternatives.
Insight #1: In the Beginning, there was No History
We should not overlook the achievements of American Airlines prior to the launch of Dynamo. As soon as deregulation happened in 1979, Crandall and his marketing team started figuring out how to do revenue management without automation and without history. They used intuition, expert knowledge and gutsiness. The take-away is Demand Forecast without History can be done successfully when we step back and remember why we do what we do.
Insight #2: To Restart Only Requires Finding an Adequate Initial Demand Forecast
Let’s examine the conceptual structure of a pricing or revenue management system. The basic concept behind maintaining a demand forecast rests on the idea of updating an existing estimate repeatedly as new sales data becomes available.
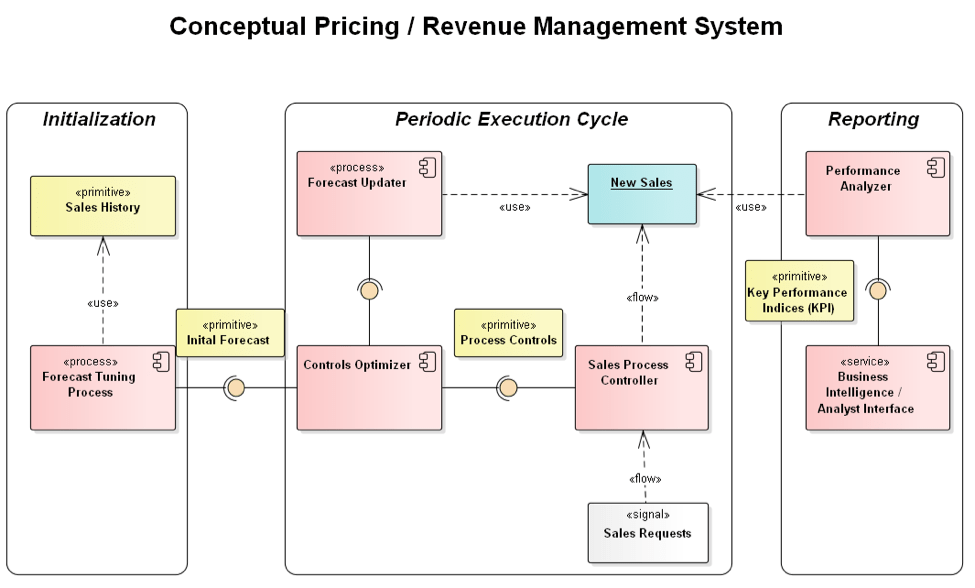
In this abstraction of a P/RM system, the periodic execution consists of the following steps:
- Feed the current demand state to an optimizer producing controls on the sales/booking process.
- Run the sales process using the controls to filter sales/booking requests
- Capture the new sales/booking records.
- Update the existing demand state with the new sales/booking data
- Return to Step 1 and repeat
What we know as the revenue management or dynamic pricing process happens in the periodic execution cycle. If we can kickstart this process sensibly, then the updater will converge on its own to reasonable demand forecasts. This is true whether the system uses a simple moving average, an exponential smoother, Holts-Winter, ARIMA models or a sophisticated Bayesian updater.
Thus, we need to have a long think on how we replace the initialization process on the left-hand side of the diagram.
Insight #3: Focus on Output and Performance, Not Inputs
If the initialization process cannot be executed due to the lack of history, let’s look at other potential starting points. The initial demand state feeds the optimizer to create an initial set of controls. This means the initial set of controls have not more information content than the initial demand state. From an information theory perspective, supplying an initial set of controls is thus equivalent to using an initial demand state.
If we start with the controls then we have two challenges to confront:
- How do we pick a relatively good set of controls to start with?
- We still need a reasonable proxy forecast of demand to feed the updater.
Insight #4: When you Lack Data, Base Decisions on the Informed Opinion of Experts and Account for the Risk Arising from Over- or Under-estimation
In addressing these two challenges, perhaps we can consider the practice of those making such decisions regularly, senior leadership. Decision-making with lack of sufficient data and large amounts of uncertainty dominates their jobs. Since decisions have to be made in a timely manner, often before data can be gathered, senior leadership must use expert opinion to guide them in making the most informed decision they can. Moreover, they understand opinions may be skewed so they have to do sensitivity analysis.
In our solution, we can model their decision style by using probability distributions to represent inputs and the Monte Carlo simulations to derive a large number of possible scenarios then examine the performance profiles over those scenarios.
Insight #5: Use Brute Computing Power and Numeration to Develop Mapping
We know from the previous sections a clean solution does not exist. When mathematicians are confronted similar problems lacking an intuitive solution, such as in the four-color problem, they have learned there is nothing like a big, fast computer and straight-forward brute force. They will just search all possible solutions. We can slightly improve the search algorithm with branch and bound techniques, genetic algorithms or simulated annealing. Moreover, the profit for each initial solution lacks a closed-form solution, we need to use simulation to discover the profit distribution.
Now we are ready to design a systematic process for identifying a set of acceptable initial demand states modeled as probability distributions. As suggested in Insight #3, we will start by selecting an initial set of control parameters for each market. Now for 14 to 20 days use the process controls and collect the results of the sales process. This will allow us to build a performance profile for the set of process controls.
At this point we would like to relate the performance profile to a set of candidate demand distributions that would produce a similar performance profile. This would require a mapping between performance profiles and demand distributions. The algorithm for constructing the mapping then matching observed performance profiles to canonical profiles used in the mapping. Rather than get into the details here, suffice it to say that standard techniques known for years can be retooled and combined into an intuitive solution. For interested please contact me at johnl@pauloventures.com and I will email you the details.
Insight #6: Convert the Reporting Process into a Statistical Control Mechanism Use KPI
Notice in the Conceptual Modeling of a P/RM system the information derived in the Reporting Process is not used directly. This means we are losing lots of data derived from performance of the system over time. Harnessing this creates the possibility of deploying a Continuous Improvement Process (CIP) and learning from mistakes and our successes.
To address this we can use a Statistical Control Methodology to continuously improve our performance. Designing the statistical control process can be embedded in a Sigma Agile architecture. Now the enterprise has a structured means of organizing its pricing / revenue management departments. Moreover, it should be possible to build an AI that will hunt for optimal control setting, which would in turn greatly reduce the number of analysts required to maintain the system.
Conclusions
Using the six insights, an enterprise can find the means of restarting its P/RM system(s) in a structured manner, even when it is facing a tabula rasa.
If your enterprise wishes to explore these ideas or see how to create the solution recommended here, please contact us at Paulo Ventures.
Paul Campbell, CEO and Founder – paulc@pauloventures.com
John Lancaster – Chief Scientist – johnl@pauloventures.com
